Today's educational world is filled with data collection, progress monitoring, and somehow knowing what to do with it all. Over the last couple of years, I have worked hard to develop systems and procedures for making the data collection process easier.
This past year, I monitored the fluency and comprehension rates for a group of fourth grade students for my evaluation so the pressure is on to make sure that my methods for collection and organization is top notch. While working on this, I was also taking a Response to Intervention class for my masters. The two things could not have come at a better time. The following post may make you feel like your back in school but trust me it is full of valuable information!
The Data Collection Process
Data collection can occur in many ways depending on your style, what works best for your group of students, and schedule. Since I was monitoring fluency for a group of 18 students, I struggled with how to find the time to complete all of the students efficiently and effectively. During the first nine weeks, I would attempt to do a running record and ask comprehension questions with each student. After working at this for four days just to complete ONE round of data collection, I knew I had to find another way. This was too time consuming and left me little time to actually deliver interventions to help them improve on their fluency.
Meanwhile, my husband was using the Educreations app to make videos for his flipped classroom. While observing him recording a video one evening, I had a great idea to let me students read aloud to the iPad and I could listen to it all later. Saving me three days of wasted progress monitoring time.
I hand my students the iPad with the app open and the fluency passage that comes with our reading series so our kids are being monitored on a grade level text. They press record, read the passage, and raise their hand when they are finished. Then, I can ask them their comprehension questions in about 45-60 seconds depending on the student.
They LOVE this! There are also many advantages to this, such as getting a true indication of how the student reads independently as well as taking away the nerves of having a teacher sit next to them recording each and every miscue they make while reading.
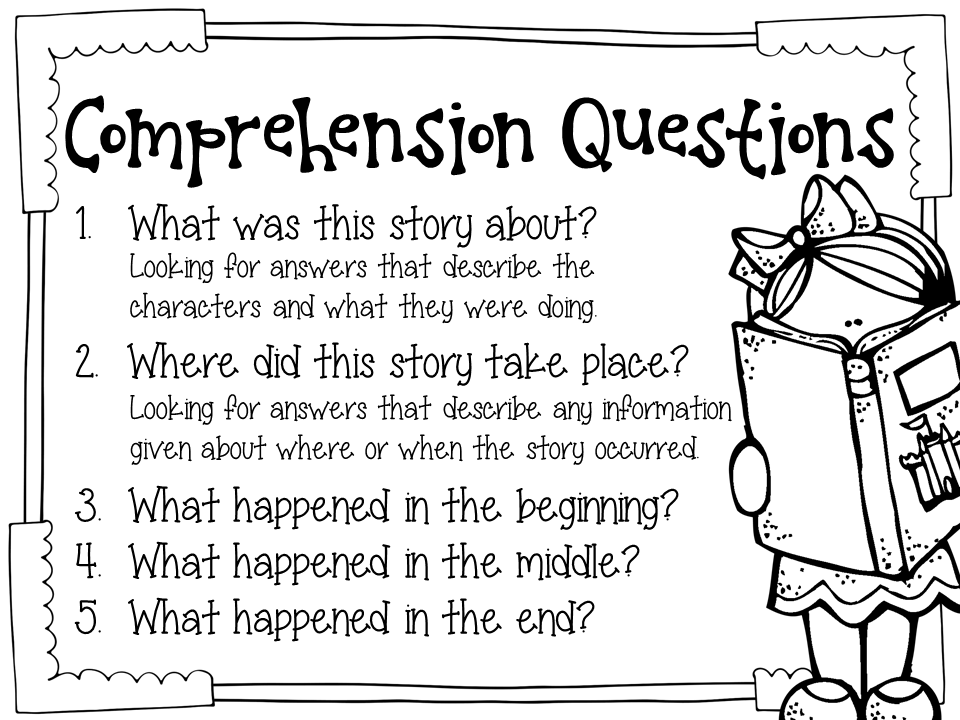
I always ask them the questions included in the freebie below. Click on the image to download a pdf version. I also provide this to parents at my annual conferences so they can ask the same questions and discuss the answers at home. I tell parents that these same questions can apply to movies, cartoons, and TV shows as well as books. They are basic questions and if they cannot answer these, then deeper more meaningful comprehension is not possible.
Overwhelmed yet?!?!
Making Use of the Data
Here comes the fun part!!! I discovered this website through my masters class where I was required to complete a module from the IRIS Center on Response to Intervention. {VERY helpful and insightful if you want to check it out!} Part of the assessment process that is often skipped is the part to make use of the data to drive intervention. The IRIS Center has included a special calculator that helps to determine if an intervention is effective. {This calculator really just calculates slope....if algebra isn't your strong suit, I would stick with the calculator!}
As you can see from the chart above, the slopes of my student's fluency scores range from 0.29 to 2.6. Since this is my own intervention and monitoring series, there is not a predetermined value for slope to prove whether an intervention is effective or not. However, I can use common sense to see that if some students are progressing at a rate of 1.5 or above and others are less than 0.5 something else must be done to those lower level students. Although my students are all increasing in their fluency speed, could something else be done to help these students progress at a higher level?
Thanks for reading my post! If you like what you see, feel free to check out my blog by clicking "The Primary Gal" button below!
Now it's your turn....how do you progress monitor?


A consideration for your students who are progressing at a rate below expectation would be to analyze the pattern of miscues and calculate accuracy rates. Anything below 93% accuracy is actually a decoding issue.
ReplyDeleteMany times a lack of progress in fluency measures is actually caused by an underlying gap in decoding skills that are preventing students from reading with automaticity.
I love the idea of having recordings because it can provide a record of progress across time, and it would be really helpful at assuaging some of the fear that comes from oral reading for some students. Love this post!! Keep up the great work.